A) more cells in the 100 ml.
B) more cells in the 200 ml.
C) the same number of cells in both.
D) The answer cannot be determined based on the information provided.
F) All of the above
Correct Answer

verified
Correct Answer
verified
Multiple Choice
Consider a culture medium on which only gram-positive organisms such as Staphylococcus aureus colonies can grow due to an elevated NaCl level. A yellow halo surrounds the growth, indicating the bacterium fermented a sugar in the medium, decreasing the pH as a result and changing the color of a pH indicator chemical. This type of medium would be referred to as a(n)
A) selective and differential medium.
B) differential medium.
C) selective medium.
D) enrichment culture.
E) differential and enrichment culture.
G) A) and C)
Correct Answer

verified
Correct Answer
verified
Multiple Choice
Which of the following is an advantage of the direct microscopic count?
A) sample volume is unknown
B) requires no incubation time
C) can easily distinguish live from dead cells
D) can readily count organisms that are motile
E) requires a large number of cells
G) D) and E)
Correct Answer

verified
Correct Answer
verified
Multiple Choice
Which group of microorganisms is most likely to spoil a freshwater trout preserved with salt?
A) hyperthermophiles
B) psychrophiles
C) facultative halophiles
D) anaerobes
E) thermophiles
G) B) and C)
Correct Answer

verified
Correct Answer
verified
Multiple Choice
An experiment began with 4 cells and ended with 128 cells. How many generations did the cells go through?
A) 5
B) 6
C) 32
D) 64
E) 4
G) B) and E)
Correct Answer

verified
Correct Answer
verified
Multiple Choice
Figure 6.3
 -In Figure 6.3, which tube shows the expected growth pattern for a microaerophile?
A) a
B) b
C) c
D) d
E) e
G) A) and E)
Correct Answer

verified
Correct Answer
verified
Multiple Choice
Figure 6.3
 -In Figure 6.3, which tube shows the expected growth pattern for a facultative anaerobe?
A) a
B) b
C) c
D) d
E) e
G) B) and D)
Correct Answer

verified
Correct Answer
verified
Multiple Choice
Which enzyme catalyzes the reaction: H2o2 + 2H+ → 2H2O?
A) catalase
B) oxidase
C) peroxidase
D) superoxide dismutase
F) All of the above
Correct Answer

verified
Correct Answer
verified
Multiple Choice
Patients with indwelling catheters (long-term tubes inserted into body orifices for drainage, such as through the urethra and into the urinary bladder) are susceptible to infections because
A) bacteria cause infections.
B) injected solutions are contaminated.
C) infections can be transmitted from other people.
D) their immune systems are weakened.
E) biofilms develop on catheters.
G) B) and E)
Correct Answer

verified
Correct Answer
verified
Multiple Choice
The term aerotolerant anaerobe refers to an organism that
A) tolerates normal atmospheric nitrogen gas levels.
B) requires less oxygen than is present in air.
C) does not use oxygen but tolerates it.
D) is killed by oxygen.
E) requires more oxygen than is present in air.
G) B) and E)
Correct Answer

verified
Correct Answer
verified
Multiple Choice
Most bacteria reproduce by
A) budding.
B) binary fission.
C) aerial hyphae.
D) fragmentation.
E) mitosis.
G) C) and D)
Correct Answer

verified
Correct Answer
verified
Multiple Choice
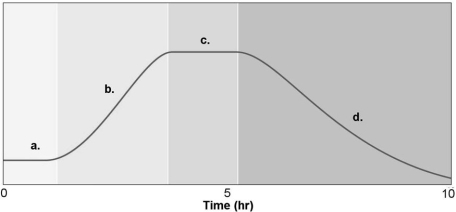
Figure 6.2
 -Figure 6.2 shows a typical bacterial growth curve with the y-axis indicating the log of the number of bacteria and the x-axis indicating time in culture. In the figure, which sections of the graph illustrate a logarithmic change in cell numbers?
A) a and b
B) a and d
C) c and d
D) b and d
E) a and c
G) B) and C)
Correct Answer

verified
Correct Answer
verified
Showing 41 - 52 of 52
Related Exams